


LOAD TRACKING
Section B of Systematic Training

"What gets measured gets managed." - Peter Drucker

MONITORING YOUR STRESS LOAD
Top reasons for monitoring load and fatigue
Prevention of injury or illness
Effectiveness of training program
Maintaining performance
Preventing early plateaus due to overtraining
TrainingPeaks™ offers a valuable advantage by enabling athletes to monitor your training loads in a data-driven manner, transcending reliance solely on subjective perceptions. Through its comprehensive tracking tools, individuals can gain nuanced insights into their training progress. This facilitates informed adjustments to their regimen, taking into account factors beyond intuition. By grasping the benchmark of an ideal training load and evaluating where your own load stands, you can make informed decisions about when to intensify your efforts and when to adopt a more cautious approach. This amalgamation of data empowers athletes with a holistic perspective on their training journey, fostering smarter training decisions and ultimately optimizing performance outcomes.
Of course, not everyone will be inclined to dig deep into this type of data but if you are so inclined or necessity dictates being a little more on top of why you do what you do, then you might want to dig in.
“Monitoring the training load of an athlete is viewed by many as important to determine whether an athlete is adapting to the training program and to minimize the risk of non-functional overreaching (fatigue lasting weeks to months), injury, and illness.” — Shona Halson

Tracking Load — How TrainingPeaks™ and similar platforms do it.
If you are tracking load, here are the calculations you should be keeping an eye on.
Here is a quick summary of each.
Training Stress Score (TSS)
Basically in TP their platform is collecting your data from heart rate, pace, and/or power output to help describe the cumulative stress and load that you perform during your training. This is so that you can quantify how much work is actually getting done, how much intensity is mixed in, if you are adding more work over time, and at what rate it is the work increasing. When we try to describe your relative intensity the "anchor" is the anaerobic threshold (AT). The AT score is based on either the heart rate or on your power output (bike) or normalized pace. Thus, the Heart rate based training stress score (hrTSS) is the stress level based on your heart rate and is tracking the "intrinsic" stress and load, whereas, the TSS power output or speed are tracking "extrinsic" loads.
Special Note: Depending on what monitoring device you use and the tracking features you prefer, TP will automatically choose the data that is available. If you use a power meter it will be the preferred metric used in determining your TSS. However, if you would rather track only the "intrinsic" load then there is an option to change the resultant TSS to hrTSS.
How the TSS Calculation Works
TSS is the training stress score which is simply the time and workload relative to the intensity factor (%threshold) or more specifically:
TSS = (sec x NP x IF)/(VT2hr*)x3600)x100
Sec = duration of workout in seconds
NP = Normalized power or could be normalized pace
IF = intensity factor (a % of VT or FTP)
FTP or VT2hr= function threshold or lactate threshold
3600 = number of seconds in 1 hour
When we calculate this value we can now start to evaluate recovery needs & recommendations.
Using TSS to Estimate Recovery Needs
Adapted from Andrew Coggan, Ph.D. and Joe Friel

Estimated Recovery Requirements Based on TSS
Adapted from Joe Friel

Chronic Training Load (CTL)
CTL is the chronic training load (aka, fitness) and takes into account training consistency and the TSS over the last 6 weeks to several months. We can call it the estimator of your "fitness" according to your progression in training load. Now keep in mind - you can spend a lot of time at a low intensity and accumulate high TSS values that don't necessarily represent the higher intensity effects.
CTL is more a respecter of load progression over time. In reality you could be more "fit" by doing 2-3 high quality (e.g. HIIT) workouts a week compared to 6-7 longer slow intensity workouts.
The point here is that an increasing CTL reflects the increasing value of TSS and the rate of it's increase should be evaluated to avoid potential over training problems (e.g., training load progresses at rate beyond the ability to cope or adapt). However, individuals who train at low volume can still build up good fitness on only a few days a week of training at a relatively low TSS. Depending on your goal event(s) or current fitness status you may or may not want to push up your weekly TSS.
The point here is that an increasing CTL reflects the increasing value of TSS and the rate of it's increase should be evaluated to avoid potential over training problems (e.g., training load progresses at rate beyond the ability to cope or adapt).
With CTL’s Keep This In Mind
You will most likely be looking at your CTL to see how you are progressing in your load over time. At some point you would not necessarily try to increase the CTL but perhaps maintain it or alternatively you may phase up and down around the ideal CTL depending on upcoming events or a realistic workout time that you have available in different seasons.
Ramp Rate
The CTL Ramp Rate can be used as a predictor of your Injury or overtraining risk. If the rate from week to week at which you increase your chronic loads is too steep, overtraining symptoms may result. Here are some suggested Weekly Ramp Rates. If your CTL is:
CTL 45 or Less
Low Risk 4 (9%)
Mod Risk 6 (13%)
High Risk 8+ (18%)
CTL of 70+
Low Risk 6 (9%)
Mod Risk 8 (11%)
High Risk 10+ (14%)
So, for example, if you are starting at a low volume of training and each week your CTL is increasing by 8 points then you would be at a significant risk for injury or other overtraining problems.
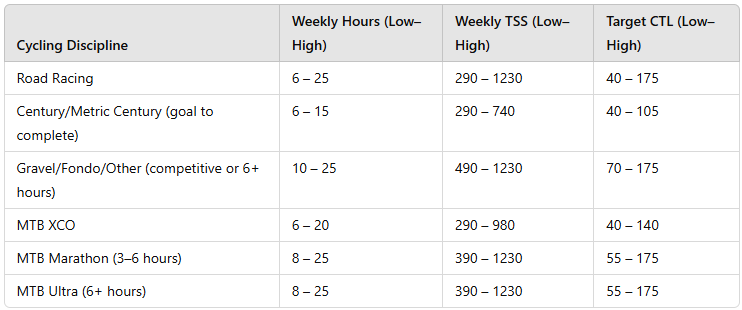
Here are some table for various athletes on Target TSS and CTL’s adpated from articles on the TrainingPeaks™ blog.
TRIATHLON
CYCLING
RUNNING
Duration Based

Distance Based

OTHER

Here is another example of how to interpret your workout based on both the TSS and your current CTL. In an article by Andrew Simmons he describes three intensity levels in the following explanation.
Hard Workout - A hard workout will result in a TSS score that is 50%-100% above your current CTL (TSS for a hard workout would be 75 – 100 TSS.)
Moderate Workout – A moderate workout will result in a TSS score that is 25% above your current CTL (TSS for a moderate workout would be 60-70 TSS.)
Easy Workout – An easy workout will result in a TSS score that is 10-25% below your current CTL (TSS for an easy workout would be 35-40 TSS)
Acute Training Load (ATL) ~ FATIGUE
ATL is the acute training load (AKA fatigue) which looks at the TSS over 7 days, representing the training for the last two week period of time, and it estimates "fatigue".
So it combines duration and intensity for the most recent period. Representative of the training for a relatively short period of time compared to CTL’s 6-7 weeks
Training Stress Balance (TSB) ~ Form
TSB is your training stress balance (aka, form) and is the balance between CTL and ATL.
So you can say TSB = CTL - ATL
A high Form is apparent when CTL is high and freshness (TSB) is positive. A higher ATL than CTL suggests a negative TSB (not fresh) while a lower ATL than CTL shows a positive TSB fresh. These TSB and ATL values become important when an athlete is trying to push up fitness while preparing to be in optimal form for a goal event or "A" race.
A suggested TSB range for:
Race Day = + 15-25
Transition phase = +10
Intensity Factor (IF)
IF is the intensity factor which is the relative intensity (i.e., relative to Threshold = AT or FTP). An example of typical IF values in cycling for various training sessions or races are as follows:
Less than 0.75 recovery rides
0.75-0.85 endurance-paced training rides
0.85-0.95 tempo rides,
aerobic and anaerobic interval workouts (work and rest periods combined), longer (>2.5 h) road races
0.95-1.05 shorter (g.e., 15 km) TT’s, track points race
Greater than 1.15, prologue TT, track pursuit, track miss-and-out
Here is a excellent chart adapted from TrainingPeaks and Joe Friel revealing target IF for various events and level of athletes.

Efficiency Factor (EF)
Looking at your data to evaluate your ECONOMY changes
Efficiency Factor (EF) EF represents your economy (energy sparing) levels. See the Key Component #5 for more information on how to economize your movements.
EF equals the ratio of heart rate to power (Pw:Hr) or heart rate to pace (Pa:Hr). With steady state exercise in the lower zones (zone 1-3), an increase would suggest an improvement in AEROBIC fitness. You will need to be able to track power output (or a controlled speed) and heart rate to come up with an accurate EF.
“EF is based on the simple principle that as fitness improves, you go faster (or produce more power) at a given heart rate. Therefore, as your EF increases, your aerobic fitness likewise increases.” Keep in mind the heart rate can be variable from day to day and there are a plethora of variables that can affect it; like temperature, other stress, sleep, hydration, etc.
Aerobic Decoupling (Pw:Hr and Pa:HR)
Decoupling compares EF in the first half of the workout with EF in the 2nd half. If change is small (< 5%) may indicate improved aerobic fitness and guidelines to suggest that your aerobic base is well established.
SO WE CAN EVALUATE OUR "ENDURANCE BASE" BY EVALUATING EF ON CONTROLLED ZONE 2 WORKOUTS.
For example, to measure EF and the Decoupling changes (or training progress) it is a good idea to create and record a workout session periodically, one that you can control and repeat the setting, in order to see how your efficiency is progressing. In these controlled workouts you should record heart rate and the external load (eg. power or pace) at a steady state intensity level. The aerobic threshold (AeT) heart rate (plus or minus 2 beats) is a perfect intensity to try to maintain. You can do this for 20 minutes or a couple hours. It just depends on the type of endurance event you have been training for. The software in Training Peaks will take your uploaded heart rate and normalized speed or power data to determine your EF for that segment of time. If the values are going up then aerobic fitness and efficiency are improving.
Note: EF may not show improvement some weeks (if you are testing yourself once weekly) even though you may be improving.
There are many variables that can affect heart rate (eg., hydration, heat, sleep, psychosocial stress) from day to day so it’s not a perfect assessment. However, if you are watching the trends over weeks and weeks you should see indications of a positive effect.
Variability Index (VI)
VI comes down to how “spiky” is your power data during the ride. Spiky meaning varying between high wattage spikes and easy “soft” pedaling. If the VI is lower it means you have been able to maintain a steady effort while a higher VI suggests intervals of up and down efforts. Generally a steady state type effort will allow you to conserve more energy.
The VI is calculated by dividing your Normalized Power by your Average Power. In a longer triathlon a steady and even output should have a VI of 1.05 or less. During higher intensity and surging races (eg. a criterium race) your VI may be as high as 1.2 or more.
Drills to enhance pedal stroke and rides that work to manage your intensity (avoid surges) or too much undulation in load can improve sustainable power and efficiency.
Here is a good article that describes the variability index
Related articles & videos
References
Joe Friel and Andrew Coggan, Ph.D.
Jim Vance
Andrew Coggan, PhD.
Joe Friel- Fast After 50, How to Race Strong for the Rest of Your Life
Go to next page: Environmental Factors