


Breath, Burn, and Beyond
Comparing Ventilatory and Lactate Analysis: Distinguishing Factors in the Application and Benchmarking of Endurance Performance and Cardiorespiratory Fitness.

In this article, my goal is to offer a deeper understanding of two popular endurance or "cardiometabolic" assessments within the realms of fitness and performance. Specifically, I will break down the protocols and provide insights into the rationale behind recommending certain tests over others.

CONTENTS
Quick History Review
History of Cardiorespiratory Exercise Test
History of Zones
Physiology Overview
Aerobic capacity
Thresholds
Substrate utilization
Practical Application
VT vs LT Which is better?
Summary of Key Concepts
To clarify some of the differences between these popular tests, let’s start with a brief history of cardiorespiratory and cardiometabolic assessment and what they reveal to the health or fitness enthusiast.
SHORT HISTORY OF ASSESSMENTS - Aerobic capacity and beyond
Aerobic Capacity
The evaluation of aerobic capacity, commonly measured as maximal oxygen uptake (VO2max), has a rich history that spans nearly a century. The concept of VO2max emerged as researchers sought to understand the body's capacity for oxygen consumption during exercise, reflecting the efficiency of the cardiovascular and respiratory systems.
In the early 20th century, there was a growing interest in exercise physiology and its impact on the human body, with a focus on understanding the relationships between oxygen consumption, energy expenditure, and exercise intensity. The Harvard Fatigue Laboratory, established in 1927, played a pivotal role in advancing knowledge in this field, conducting pioneering studies on oxygen consumption during exercise. In the 1950s, the Astrand-Rhyming test was developed by Swedish physiologists to estimate VO2max through submaximal exercise. The term "maximal oxygen uptake" or VO2max gained popularity in the 1950s and 1960s as a standardized measure of aerobic capacity. In 1968, Dr. Kenneth H. Cooper introduced the 12-minute run/walk test as a practical self test method to estimate VO2max, significantly contributing to the popularity of this aerobic terminology.
Cardiopulmonary Exercise Testing
Then came the Cardiopulmonary Exercise Test (CPET) which is marked by the development of a comprehensive and integrated approach to assess both cardiovascular and respiratory responses to exercise.
In the late 19th and early 20th centuries, researchers like A.V. Hill laid the groundwork for understanding cardiorespiratory responses to exercise. The mid-20th century saw a growing interest in assessing aerobic capacity, leading to the integration of gas exchange measurements during exercise using early techniques like the Douglas Bag. The 1970s witnessed a revolution with the introduction of metabolic carts, enabling real-time measurement of oxygen consumption and other respiratory parameters. Comprehensive exercise protocols, including incremental (e.g., longer stages) and ramp (e.g., short or continuous increments) protocols, became common in the 1970s-1980s. Ventilatory and cardiovascular thresholds, such as the anaerobic threshold, were identified, providing even deeper insights. CPET found applications in clinical settings in the 1980s-1990s, becoming widely adopted and standardized in the 2000s. Technological advancements, including non-invasive measurements, have refined CPET, and it now serves diverse purposes, from sports performance optimization to medical practice. Here are some of the output measures from CPET testing.
Development of Metabolic Profiles:
The advent of metabolic carts in the 1960s marked a significant advancement. These systems allowed for real-time measurement of oxygen consumption (VO2) and carbon dioxide production (VCO2) during exercise.
These carts provided more accurate assessments of energy metabolism and ventilatory parameters.
Ventilatory Threshold and Anaerobic Threshold:
Researchers started identifying and studying ventilatory thresholds, such as the point at which ventilation increases disproportionately to oxygen consumption during exercise.
The concept of anaerobic threshold emerged, representing the point at which anaerobic metabolism begins to contribute more significantly to energy production.
Application in Sports Science:
Ventilatory testing became a valuable tool in sports science for evaluating athletes' aerobic fitness and anaerobic influence, optimizing training programs, and monitoring performance.
Clinical Applications:
In clinical settings, ventilatory testing is used to assess respiratory function, diagnose respiratory diseases, and evaluate the impact of interventions.
Exercise testing with respiratory gas analysis helps clinicians understand how the respiratory system responds to physical activity, aiding in the management of conditions like chronic obstructive pulmonary disease (COPD) and heart failure.
In summary, the Cardiopulmonary Exercise Test has evolved from early investigations into oxygen consumption to a sophisticated, integrated assessment tool that provides comprehensive insights into both cardiovascular and respiratory responses during exercise. Its adoption in both research and clinical settings has significantly contributed to our understanding of human physiology and the diagnosis and management of various health conditions.
Lactate Testing
The history of lactate testing for fitness and endurance performance is characterized by advancements in understanding the role of lactate in exercise physiology and the development of methods to measure lactate levels. Here's a succinct overview:
Lactate, a byproduct of anaerobic metabolism, has been recognized by scientists since the early 19th century, though its role in exercise physiology was not fully understood at first. In the mid-20th century, it was acknowledged that lactate could function as a fuel source for muscles during exercise. The 1960s and 1970s saw the introduction of the lactate threshold concept by researchers like Per-Olof Åstrand and Bengt Saltin, defining it as the exercise intensity where blood lactate accumulation significantly increases. Lactate testing protocols emerged in the 1970s, employing incremental and constant load tests to determine individual lactate thresholds and metabolic fitness. The 1980s brought portable blood lactate analyzers, enabling real-time measurement and facilitating widespread use for research and practical training. The identification of lactate thresholds led to personalized training zones for athletes, optimizing performance. In recent years, non-invasive technologies like near-infrared spectroscopy have been explored for lactate estimation without blood sampling. Today, lactate testing is widely employed in various endurance performance sports and fitness settings to assess metabolic fitness, guide training intensity, and monitor performance improvements.
Note that lactate analysis has been around for a long time, longer than CPET testing, undoubtedly lending credence to the popular opinion that lactate testing is more relevant to the physiological effects resulting from various endurance training loads.
Ultimately, however, a 'preferred' method - between ventilatory (CPET) and lactate testing - should depend on the specific goals and context of the assessment. Some athletes and coaches may discover that a combination of both lactate and ventilatory testing offers the most comprehensive insights into an individual's endurance performance and metabolic characteristics. Others may opt for shorter protocols due to the subject's limited abilities or resources (e.g., physical capability, time available, and financial resources) at their disposal.
At the Fit Stop Human Performance Lab we offer several endurance-oriented tests, elaborated on in the "Cardiopulmonary Exercise Profiles" section of my Substack Testing Guide. Among these, the Cardiometabolic Exercise Profile stands out as my preferred choice for most populations due to its comprehensive nature, delivered within a short and efficient protocol. However, depending on the athlete's level and coach preferences, I also offer longer staged lactate profiles, often combined with ventilatory evaluations.
Both ventilatory and lactate testing do an excellent job at revealing legitimate benchmarks to assess the effects from training and to design an individual’s training parameters (e.g., zones) for more precision oriented training.
HISTORY OF ZONES
The concept of the aerobic training zones was popularized by American physician Dr. Kenneth H. Cooper in the 1960s and 1970s through his influential book "Aerobics." Dr. Cooper introduced the term "aerobics" and emphasized the importance of aerobic exercise for cardiovascular health. He advocated for training within a specific heart rate range to optimize aerobic fitness, laying the foundation for the widespread adoption of aerobic training zones in the fitness industry. His work has had a lasting impact, influencing how people approach cardiovascular exercise and contributing to the development of aerobic exercise programs that remain integral to fitness practices today.

Here are the original five zones proposed by Dr. Kenneth Cooper were based on the predicted max heart rate of the exerciser:
Zone 1: Very Light (50-60% of max heart rate, MHR):
This zone represents very light exercise, suitable for warm-up and cool-down activities.
It is typically below the target heart rate for aerobic conditioning.
Zone 2: Light (60-70% of MHR):
Light aerobic exercise that is comfortable and sustainable for longer durations.
This zone is often used for the "fat-burning" zone.
Zone 3: Moderate (70-80% of MHR):
Moderate-intensity exercise that improves cardiovascular fitness and endurance.
This zone is commonly associated with basic cardiovascular fitness.
Zone 4: Hard or High (80-90% of MHR):
Hard aerobic exercise that challenges the cardiovascular system and improves overall fitness.
This zone is often used for interval training and higher-intensity workouts.
Zone 5: Very Hard or Maximum (90-100% of MHR):
Very hard or maximum-intensity exercise that is sustainable for short periods.
This zone is often used for high-intensity interval training (HIIT) and performance training.
Before Dr. Cooper popularized aerobic zone training, another heart rate training formula was developed and would later be adopted as the go-to formula because it attempted to differentiate between individual differences using heart rate reserve. This formula is referred to as the Karvonen formula.
Martti Karvonen's formula, developed in 1957, is based on the physiological concept of heart rate reserve (HRR). The formula takes into account an individual's resting heart rate (RHR) and aims to prescribe exercise intensity as a percentage of the heart rate reserve. Heart rate reserve is the difference between an individual's maximum heart rate (MHR) and their resting heart rate. The formula is as follows:
Target Heart Rate (THR)=(HRR×Intensity)+RHR
Target Heart Rate (THR)=(HRR×Intensity)+RHR
where:
THR: Target Heart Rate
HRR: Heart Rate Reserve (MHR - RHR)
Intensity: The percentage of HRR at which you want to train
RHR: Resting Heart Rate
MHR: Maximum Heart Rate
The physiological rationale behind this formula is that it takes into account an individual's baseline (resting) cardiovascular activity and calculates a target heart rate range that reflects the desired exercise intensity. This approach recognizes that different individuals may have different heart rate ranges according to their physiology and adjusts the target heart rate accordingly.
The basis for both of these zone methods is the individual's maximum heart rate, which is estimated using age-based formulas (e.g., 220-age). The zones provide a simple and accessible way for individuals to gauge and control the intensity of their aerobic exercise. However, it's worth noting that the concept of training zones has evolved over time, and modern approaches involve more personalized methods, such as using threshold testing and other individualized field test metrics.
Contemporary training methodologies are embracing an integration of diverse metrics, including heart rate, power, pace, and even perceived effort (RPE). This holistic approach provides a more comprehensive assessment of an individual's training status or level. Simultaneously, there has been a notable shift towards High-Intensity Interval Training (HIIT) and intense interval-based workouts, challenging the conventional zone-based approaches such as those outlined in the Karvonen formula, which may not entirely encapsulate the nuances of these dynamic training methods.
To optimize a more personalized approach to zone training and testing requirements, it is essential to comprehend the physiology of these representative metabolic domains.
PHYSIOLOGY OF THE CARDIOMETABOLIC ASSESSMENT
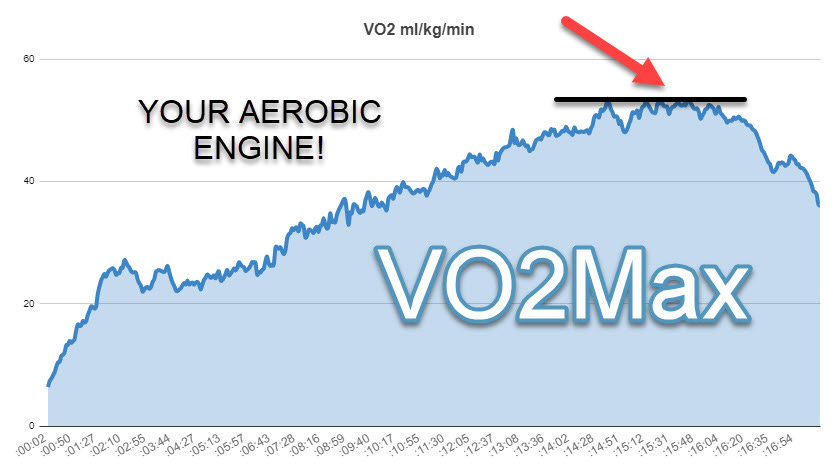
AEROBIC CAPACITY (VO2Max)
Your aerobic capacity is essentially a description of the size of your aerobic engine. The prevailing method for assessing cardiorespiratory fitness involves directly measuring the volume of oxygen during maximal exercise, known as VO2max. Recognized as the gold standard, VO2max is widely regarded as the most precise approach to determining overall cardiorespiratory fitness.
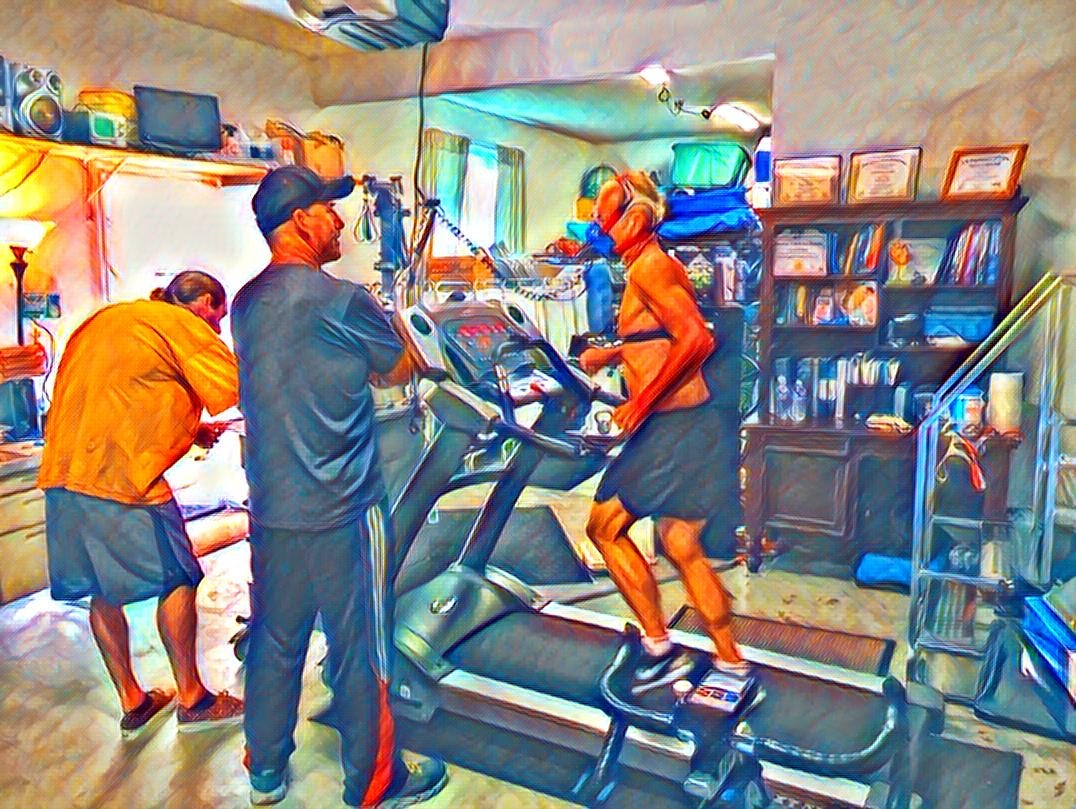
To determine your true VO2Max you will need to find a facility with a Metabolic Cart. This cart should include oxygen and carbon dioxide gas analyzers, an expiratory air flow probe, an air mixing chamber, a dehumidifier, a vacuum pump, and a data acquisition system. Most are all computerized systems containing all of these things in one unit.
Ultimately, your VO2Max or aerobic capacity denotes your maximum rate of oxygen consumption (O2) achieved at the conclusion of a progressive staged or ramp exercise test. A higher rate suggests greater potential for sustained work, such as exercise. Physiologically it represents your ability of the heart, lungs, circulatory system and muscles to deliver and utilize oxygen to perform and sustain work.
It can also be said, according to Coach and Exercise Scientist Sabastian Weber (from Inscyd), that not only does the VO2max score represent your capacity to use oxygen to produce energy in the muscle, but that “the higher your VO2max, the higher your aerobic power, anaerobic threshold and maximal ability to burn fat (FatMax) – all other things equal. In many (endurance) sports, these parameters are crucial.”
When looking at the aerobic capacity we can also evaluate what is limiting your capacity by identifying the extent of peripheral or central limitations.
Central vs Peripheral Limitations to Your Capacity
In a VO2Max test, central and peripheral limitations can be distinguished based on the reasons for test termination or the primary factors leading to fatigue. Here's an example to illustrate the difference between central and peripheral limitations:
Example:
Central Limitation:
Scenario: During the VO2Max test, the individual stops the exercise due to a feeling of breathlessness, chest discomfort, or an inability to sustain the required intensity.
Interpretation: In this case, the central limitation is likely related to the cardiovascular and respiratory systems. It could indicate issues with the heart's ability to pump blood effectively (cardiac output) or problems with the lungs' capacity to exchange oxygen and carbon dioxide efficiently.
Peripheral Limitation:
Scenario: Instead of stopping due to breathlessness, the individual terminates the test because of intense leg fatigue or a feeling of muscle failure.
Interpretation: This suggests a peripheral limitation, focusing on factors external to the heart and lungs. In this case, the muscles may be reaching their limit in terms of oxygen utilization, blood flow, or dealing with accumulated fatigue byproducts.
In summary the central limitations involve constraints within the cardiovascular and respiratory systems. Peripheral limitations are related to challenges within the muscles themselves, such as fatigue, inadequate blood flow, or issues with oxygen utilization. Distinguishing between these limitations is crucial for tailoring effective training strategies. Identifying whether the primary issue is with the heart, lungs, or the muscles helps in addressing specific aspects that may impede overall aerobic performance.
Here is a good article by John Hellemans on Oxygen Dynamics if you want to go a little deeper into the oxygen delivery and utilization weeds
Other Methodologies
for VO2Max determination
MOBILE DEVICE ESTIMATIONS
You have likely encountered VO2max estimations on your watches and other devices. These values are calculated by assessing submaximal heart rates against a training load (pace or wattage), providing a proxy for fitness and performance. This information can help you understand whether you are improving your fitness level.
Marco Altini, the developer of the HRV4training app, explains this relationship: "For runners, cyclists, or triathletes, as training enhances aerobic capacity and heart rate decreases at a given intensity, VO2max estimates align well with improvements in fitness and performance observed in racing events. This holds true for athletes of any level; you can easily find logs of Ironman champions going through a base phase that gradually lowers their heart rate at easy intensities, as well as recreational athletes improving their fitness in a similar manner." Marco Altini covers everything you need to know about VO2Max estimates here.
However, and importantly, these estimations do not necessarily align directly with your actual VO2max as measured in the lab. Keep in mind that improved movement efficiency (ME) and fractional utilization (FU) (ATVO2/MaxVO2) can also lower heart rates for particular submaximal training loads without impacting the VO2Max. See ME and FU descriptions in the next section.
The key takeaway is that you can use the VO2Max estimates from the algorithms of your mobile devices to evaluate your training effect. However, these changes do not necessarily suggest that your actual maximum oxygen uptake has been lowered or raised if you have been exercising regularly all along.
COOPER TEST - another estimating tool
Kenneth Cooper developed the Cooper Test, a simple and quick method for assessing your aerobic capacity by measuring how far you can run in 12 minutes. Click here to access a calculator tool.
Keep in mind that the VO2Max serves as a potent yet one-dimensional benchmark for assessing your aerobic fitness. On its own, it fails to pinpoint other critical benchmarks that play a role in determining your specific training heart rate and metabolic domains during zone training. For a more effective approach to identifying fitness limiters and establishing personalized training zones, it is crucial to comprehend the concepts of thresholds and substrate utilization.
THRESHOLDS
Endurance performance and fitness are often evaluated through multiple thresholds, including ventilatory thresholds (VT1 and VT2) and lactate thresholds (LT1 and LT2). These thresholds provide insights into aerobic and anaerobic metabolism transitions.
VT1, also known as the aerobic threshold, denotes the point at which there is an increase in ventilation disproportionate to oxygen consumption, indicating the shifting from relying on aerobic to more reliance on anaerobic metabolism. VT2, occurring at a higher intensity, signifies a more pronounced reliance on anaerobic processes. Similarly, LT1, the first lactate threshold, represents the intensity at which lactate production exceeds removal, while LT2, the second lactate threshold, indicates a further rise in blood lactate levels. These thresholds collectively offer valuable insights into an individual's endurance capacity, metabolic responses, and the transition between aerobic and anaerobic energy systems.
Validity & Reliability: Ventilatory and lactate thresholds are both valid and reliable.
An important study on cyclists reported that “Lactate threshold tests can be a valid and reliable alternative to ventilatory thresholds to identify the workloads at the transition from aerobic to anaerobic metabolism.”
VENTILATORY THRESHOLDS (determined during CPET testing)
VT1 & VT2 (Using O2 and CO2 and ventilation analyzers)
With the use of a metabolic cart we can determine the aerobic threshold or VT1 using the criteria of an increase in both ventilatory equivalent of oxygen (VE/VO2) and end-tidal pressure of oxygen (PETO2) with no concomitant increase in ventilatory equivalent of carbon dioxide (VE/VCO2). Additionally we look at the V-slope to determine a sudden increase in the VCO2/VO2 ratio.
Put more simply, the thresholds indicate breathing changes reflecting a build up of CO2 from energy metabolism. When CO2 increases it stimulates the brain to increase breathing rate to get rid of this excess CO2 waist product.
When creating your training zones based off of these ventilatory responses, the heart rate and power output at VT1 will generally be located at or near the top end of your zone 2.

VT2 is the 2nd breakpoint and is associated with a more significant increase in metabolic waist products like CO2. More specifically, it is the point at which there is a disproportionate rise in ventilation relative to the increase in oxygen consumption.

The heart rate and power output associated with the VT2 can be associated to a level of intensity the suggests there is a transition from sustainable work to shorter high intensity interval type sessions where the load cannot be sustained very long. The VT2 (like LT2) is our training load categorized in the 4th zone. Commonly the training load is correlated with a pace or power output that can be sustained for 40-60 minutes.
LACTATE THRESHOLDS
LT1, LT2 and MLSS - Blood Lactate analysis

With the lactate thresholds, instead of looking at the ventilatory changes, we rely on blood lactate levels to identify our trend changes. The lactate threshold (LT1) is the exercise intensity at which lactate production exceeds removal, indicating a shift toward anaerobic metabolism and providing insight into an individual's endurance capacity.
“While it does not provide the fat and carbohydrate oxidation data that a metabolic cart does, it does show shifts in the athlete's net lactate production across the range of intensity, which is indicative of peripheral aerobic development, particularly in the mitochondria of various muscle fibers. This is important information when it comes to identifying shifts in fiber types, which are crucial for directing training. Specifically, slow-twitch fibers during the General "Base" phase and fast-twitch fibers during the Specific Preparation phase.” Alan Couzens
LT2, or the second lactate threshold, refers to the exercise intensity at which there is a further increase in blood lactate levels, indicating a more significant reliance on anaerobic processes during physical activity.
MLSS - Max Lactate Steady State
This test uses blood lactate levels during long staged efforts to help you define your max steady state power (or pace and heart rate). We sometimes use this test as a confirmation test for steady state zones.
This test is recommended for the seasoned athlete since it requires 5-10 minutes stages of sustained and sometimes sustained hard effort levels. Two blood lactate measurements from finger sticks are required during all 4-7 stages of this test.
This test is essentially a laboratory estimation of functional threshold power (FTP).
An accurate detection of MLSS is particularly important due to it being considered the highest intensity in which glycogen stores are the main exercise limiting factor (Coyle et al., 1986).
MLSS has been suggest to be at a midway point between VT1 and VT2: https://www.ncbi.nlm.nih.gov/pmc/articles/PMC6167480/
METABOLIC DOMAINS AND ENERGY SUBSTRATES
We have basically three energy systems when we are discussing the work of exercise. There is the creatine phosphate (CP) system, the anaerobic system, and the aerobic system.
Imagine the body's energy systems as different vehicles on a road trip. The Creatine Phosphate (CP) system is like a high-speed or dragster sports car, providing a burst of intense energy but running out quickly. The ANaerobic system (VLa) is akin to a reliable SUV, offering sustained power for a moderate duration like an off- road trip through hilly terrain. Lastly, the AErobic system (VO2) is comparable to a fuel-efficient hybrid, steadily supplying energy for the long haul, adapting to different terrains and ensuring a continuous journey as long as there is fuel in the tank.
The threshold assessments we have discussed in this article are centered mostly around the aerobic and anaerobic transition threshold. Here is how these assessments relate to these energy domains.
AEROBIC THRESHOLD & THE FAT BUMP
Both VT1 and LT1 identify where your aerobic system starts to become somewhat compromised. Usually it’s at the upper end of your most effective fat burning intensity. This level of intensity is often referred to as your aerobic threshold or your benchmark for your Metabolic Efficiency and helps us to identify your zone 2 training level. If we are able to increase the speed or power output at the AErobic threshold then theoretically we will be able to sustain more work with less reliance on carbohydrate fuels. This is important because carbohydrate fuel stored as glycogen in the muscles and liver is limited. Much more limited than the energy we can get from fat.
Zone 2 Training will help optimize your Metabolic Efficiency, which helps your body use fats and carbohydrates more efficiently. It manipulates cellular processes through aerobic training by increasing the size and number of mitochondria in your cells. Additionally, when you train in zone 2 without a lot of available carbohydrates, such as after fasting and by limiting fueling during exercise the body can increase the workforce of enzymes to metabolize more fat.
Some of the most respected exercise physiologists in the performance and health research arena today consider zone 2 training to be the most effective at building your aerobic potential. Iñigo San Milán concludes that “the zone 2 is indeed the most effective training zone for increasing mitochondrial functioning”
Also, check out this article by Alan Couzens, M.Sc. Article on strategies to improve performance by increasing Fat burning. For example, one strategy for an Ironman is to shoot for an intensity where the carbohydrate (CHO) burn rate is below 10 kcal/min.
FatMax vs VT1 or LT1
We can use the O2 and CO2 metabolic analyzer to provide a fairly clear depiction of the intensity range that represents your “fat burning zone” through a method called indirect calorimetry. And the highest level of fat utilization (FATMAX) is only identifiable through this form of metabolic testing. However there are approximations that can be made using other determination methods to evaluate where the FATMAX intensity level is by using other alternative methods . We will outline a few of these examples in the Alternative Methods section to follow.
To discuss some of the alternative ways we can estimate this aerobic fat burn domain I would refer you to a nice article from the INSCYD group. Check out the links from the quoted paragraph below to dig a little deeper.
“Lastly, many cyclists, runners and their coaches think LT1 is the intensity at which fat combustion peaks (FatMax). They use LT1 and FatMax interchangeably, for instance to determine the zone 2 training intensity described by Iñigo San Milan.
It is true that both LT1 and FatMax occur at an intensity below the anaerobic threshold. It is also true that you can increase LT1 and FatMax by increasing the aerobic energy contribution, all other things equal. As a result, you will find a correlation between LT1 and FatMax. However, they don’t necessarily occur at the same exercise intensity.”
INSCYD’s summary
“Similar to LT1, you could say that VT1 is a way to measure the aerobic threshold. Although their measurement techniques are different, it will not surprise you that some studies show that LT1 and VT1 mark similar exercise intensities.”
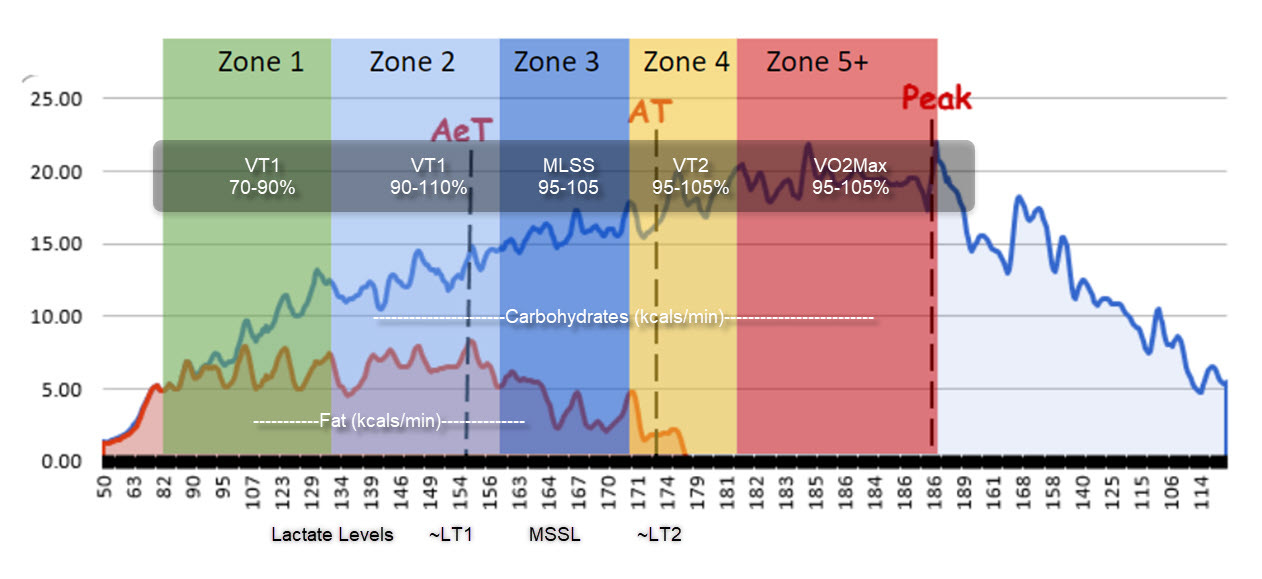
Ultimately, although not always the same, we can suggest that the VT1 and LT1 are going to be at similar work rate levels as is where we would find the FATMAX. However, keep in mind, without a metabolic cart it is very difficult to know if your FATMAX utilization rate (kcal/min) is at a relative high or low level, or if it’s improving or not improving (e.g., fat utilization move up).
Here is a graph that shows the similarities between some of the testing methods that are used and where they fit within the zones.
Other Methodologies
for THRESHOLD DETERMINATIONS
VT1:
Talk Test - Evaluates breathing impacts on talking during exercise to determine the threshold. Go to my substack on Cardiometabolic Exercise Profiles to access this test protocol.
Phil Maffetone uses his “180 Formula.” He subtracts an athlete’s chronological age from 180 and then adjusts it according to the athlete’s current fitness and health by using four categories that add zero to 10 beats.
VT2:
Talk Test - Evaluates breathing impacts on talking during exercise to determine the threshold. Go to my substack on Cardiometabolic Exercise Profiles to access this test protocol.
FTP assessments - click here for a test tool to use to identify your FTP from field testing
PRACTICAL APPLICATION
LT vs VT testing
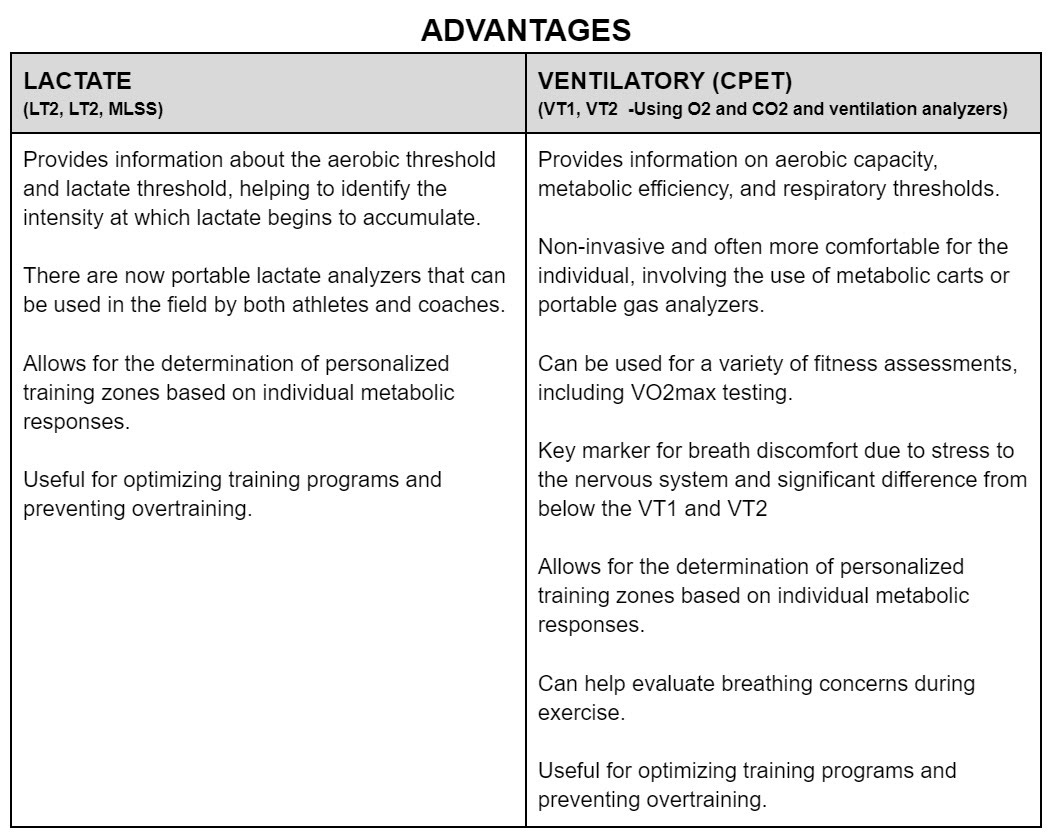
So, how do we choose between Lactate Testing and Testing Using the Metabolic Cart (CPET)?
Plus which protocols are best for you?
The first most obvious answer is you will need to have access to a facility or fitness technician who is experienced with the test protocol and has access to the appropriate equipment. If you have access to both then here is a brief outline of the advantages and limitations of each.
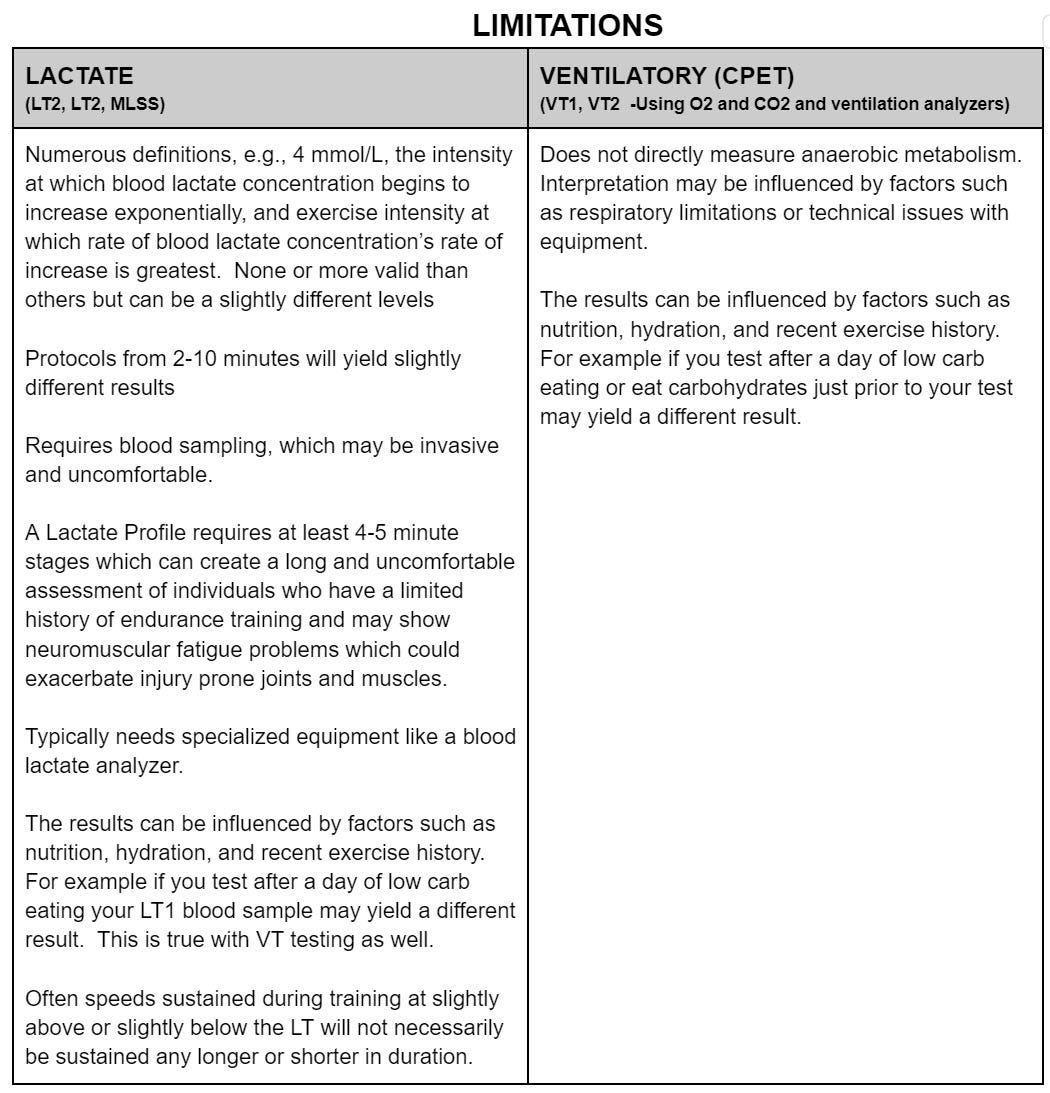
In Summary
So how do I choose?
Keep in mind, both assessments are effective at evaluating both cardiovascular and metabolic changes.
Validity & Reliability: Ventilatory and lactate thresholds are both valid and reliable.
An important study on cyclists reported that “Lactate threshold tests can be a valid and reliable alternative to ventilatory thresholds to identify the workloads at the transition from aerobic to anaerobic metabolism.”
The CPET (ventilatory test) can also evaluate your breathing responses, helping identify potential lung limitations or irregular breathing patterns. This test can also estimate substrate utilization, allowing you to evaluate your fat adaptation and carbohydrate needs.
If you have a coach, the go-to assessment is often based on the coach's comfort level, ensuring everyone is on the same page. Typically, more coaches are familiar with lactate testing.
One significant downside to lactate testing is that it requires fairly lengthy stages (4-10 minutes) and may be too much of an overreach for older, less trained, or less experienced exercisers, especially if the protocol requires running. The CPET test can be completed in a shorter period (ramp protocol) and also provides very good estimates for training zones. CPET will also generally include the measurement of your aerobic capacity (VO2). Lactate testing primarily identifies trend changes and the related thresholds.
Ultimately, both tests can be impacted by equipment reliability problems, so having an experienced technician is important to identify these issues when they arise.
At the Fit Stop Human Performance Lab, we offer several endurance-oriented tests elaborated on in the "Cardiopulmonary Exercise Profiles" section of my Substack Testing Guide. Among these, the Cardiometabolic Exercise Profile stands out as my preferred choice for most populations due to its comprehensive nature, delivered within a short and efficient protocol. However, depending on the athlete's level and coach preferences, we also offer longer staged lactate profiles, occasionally combined with ventilatory evaluations.
CHOOSING THE RIGHT PROTOCOL
Ramp vs Longer Stages
SHORT PROTOCOLS (RAMP)
Used in the CPET
The concept of the one-minute ramp test for assessing VO2Max was popularized by Dr. Jonathan Doust, a professor of Applied Physiology at the University of Brighton, UK. The test is often referred to as the "Doust ramp test" in his honor.
The one-minute ramp test is a modified version of traditional step tests used to measure maximal oxygen uptake (VO2Max) in athletes. The traditional step test involves a gradual increase in exercise intensity until the participant reaches exhaustion. The one-minute ramp test, as developed by Dr. Doust, is designed to be shorter in duration, making it more practical for certain populations.
The rationale behind the one-minute ramp test is to provide a quick and efficient way to estimate an individual's VO2Max and at the same time determine ventilatory thresholds. Pulmonary and cardiovascular function can also be assessed which is why the CPET is also used in clinical settings. We can also provide a snapshot of metabolic efficiency (FATMAX) through indirect calorimetry . The CPET provides a profile of your metabolic fitness (thresholds), metabolic efficiency (FATMAX) and aerobic capacity all in one.
This test is particularly useful for athletes and individuals who may have time constraints or find it challenging to perform multiple and longer-duration tests.
LONGER STAGED PROTOCOLS
However, the CPET is not necessarily the best test for identifying and evaluating thresholds in high end athletes since certain adaptations may require a longer look at each stage to confirm associate power output and heart rates. In these cases the max lactate steady state (MLSS) may be important to include in the testing process.
Additionally, if the goal of the test is to determine very accurate estimations of fuel requirements then a longer look at each stage may be recommended. We refer to these assessments as our metabolic efficiency profiles (MEP) and are often used to evaluate fueling strategies for endurance athletes. Especially ultra endurance athletes.
FINAL NOTE
Preparing for Your Test
Whichever assessment you choose you will need to evaluate any changes by repeating the same protocol. A different protocol may have similar results but will not provide as clear an understanding of the training effect. Additionally, be sure to arrive at your test in the same prepared state each time. Make sure sleep, eating and lifestyle patterns were similar leading up to each test. Follow the following preparation guidelines to ensure testing outcomes that will be comparable.
Before test
Physiologist Alan Couzens recommends putting the test in on a “key session” day so you should be recovered from previous workouts but not overly recovered with too many days of rest beforehand. So “adequately” recovered or training fresh. One reason is that heart rate may see higher heart rates than usual for training efforts. Additionally, forcing too many rest days can have a negative impact on training schedule.
Morning before test
Nutrition is important to control. Carbohydrates consumed too close to test time their blood glucose will be elevated, and they will be oxidizing a disproportionate amount of energy from carbohydrates. No need to do a long fast. Over 8 hours may negatively impact your strength during the test. Usually, the ideal is to fast for 3-4 hours prior to the test. So that means no carbohydrates, meals or drinks. Water is however ok and encouraged.
Warm-up before the test:
If you can get a 30-60 minute low zone (easy) walk/jog before heading in for the test.
I hope you enjoyed this article. Please feel free to contact me if you have questions regard testing at the Fit Stop Human Performance Lab or would like to schedule an appointment. Feel free to contact me at fitstoplab@gmail.com.